Synapse - A workflow Automation Engine
Building Synapse: a workflow engine that survives crashes You draw a workflow as a graph in the browser, hit publish, and a fleet of workers runs it reliably. If a worker dies halfway through, the work still gets done.
- PyTorch
- TensorRT
- CUDA
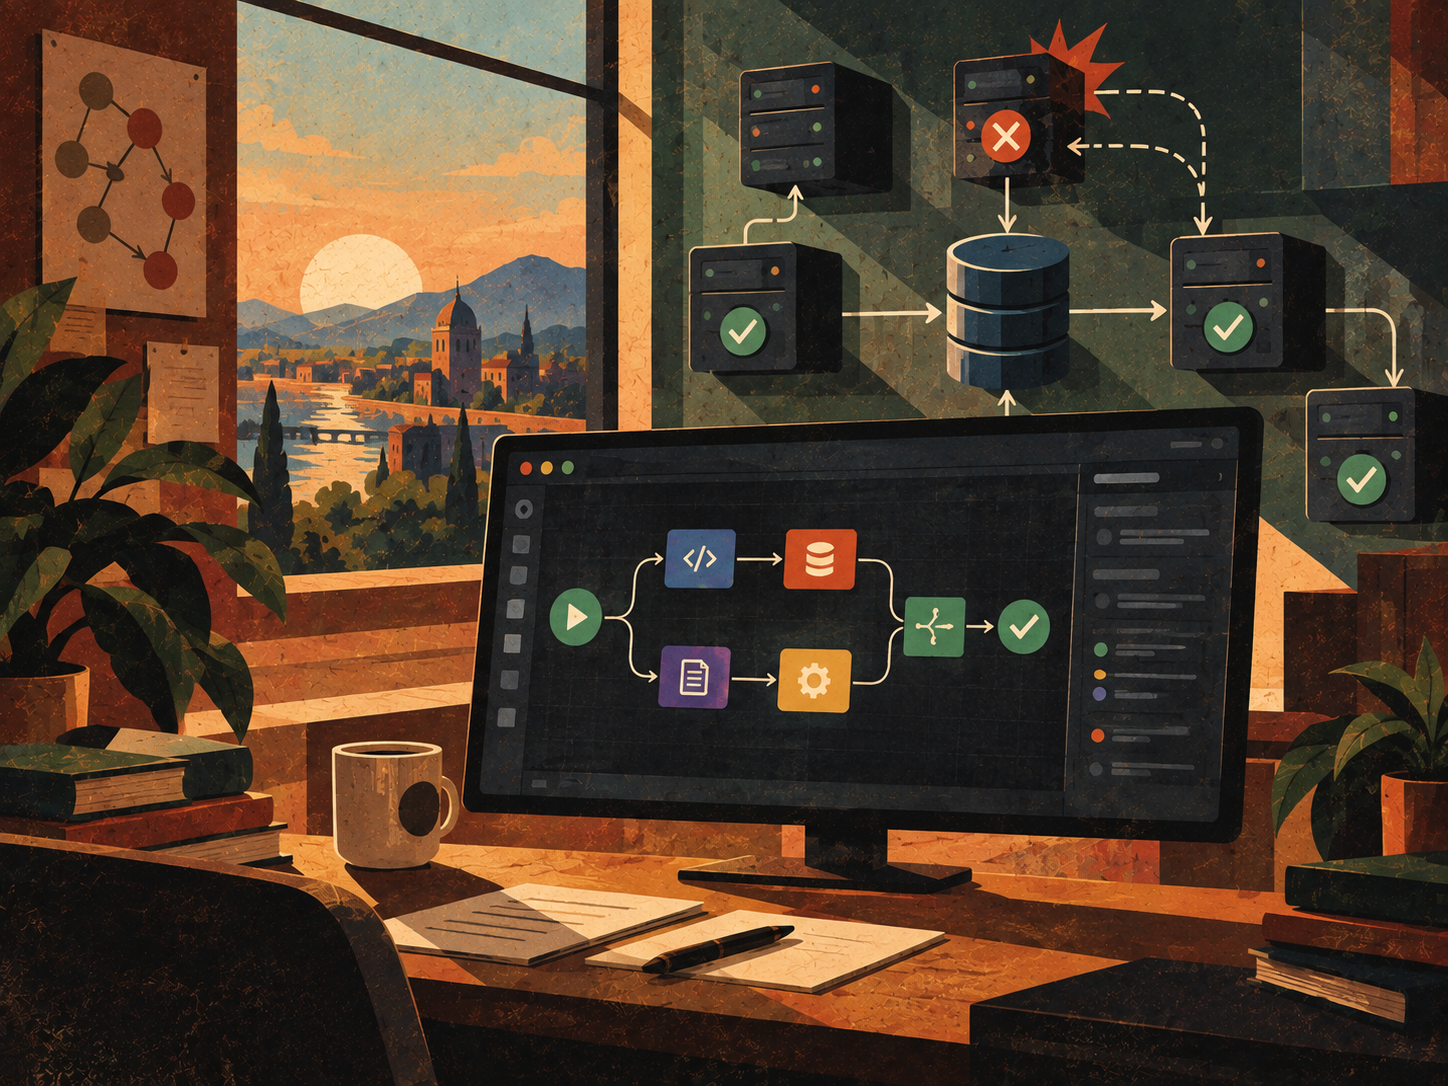
Building Synapse: a workflow engine that survives crashes
I wanted to build something that looked like real infrastructure, not a CRUD app with a nice UI. So I built Synapse, a workflow automation engine. You draw a workflow as a graph in the browser, hit publish, and a fleet of workers runs it reliably. If a worker dies halfway through, the work still gets done.
This post explains what it is, how it works, and what I measured. I'll also be upfront about what it doesn't do.
What it does
A workflow is a graph of nodes. A node can be a trigger (a webhook, a cron schedule, or a manual click), an HTTP call, a data transform, a condition, a delay, a loop over a list, or a call to another workflow.
A simple example: a webhook fires when an order comes in. A condition checks the amount. If it's large, the workflow waits an hour, calls an approval API, and then sends an email. Otherwise it goes straight to fulfilment.
What makes it more than a toy:
- Executions are durable. Once the API says "accepted", the work is in the database. Restart anything and it continues.
- Work runs outside the API. Separate worker processes pick up tasks.
- Failures are handled. Retries with backoff, timeouts, and recovery from dead workers.
- You can see everything. Every input, output, error and retry is recorded and shown in the UI, live.
- You can replay. Re-run a whole execution, or start again from a chosen node.
The stack
- Backend: Go, with three binaries: API, worker, scheduler.
- Database: PostgreSQL. It is the only source of truth.
- Redis: optional, used only to make live updates faster.
- Frontend: React, TypeScript, Vite, and React Flow for the graph editor.
- Deploy: Docker Compose and Kubernetes manifests, with Prometheus metrics and OpenTelemetry tracing.
I didn't use a workflow framework and I didn't use eval for expressions. Both were deliberate: the point was to understand the hard parts.
Why the queue lives in Postgres
The usual answer is "add a message broker". I didn't, for one reason: atomicity.
When a worker finishes a task, several things must happen together: save the result, decide which nodes are now ready, queue them, and record events for the UI. If the queue is a separate system, you have to keep it consistent with the database, and that's where bugs hide.
With everything in Postgres, that whole step is one transaction. Either all of it happened or none of it did.
Workers claim tasks with SELECT ... FOR UPDATE SKIP LOCKED. This lets many workers pull from the same table without blocking each other. Each worker skips rows another worker already locked and takes the next one. When a task is queued, Postgres also sends a NOTIFY, so idle workers wake up immediately instead of waiting for a poll.
The trade-off is that throughput is limited by what one Postgres can commit. I measured that, and you'll see the numbers below.
Leases and fencing: what happens when a worker dies
Every claimed task gets a lease: a random token and an expiry time. The worker keeps extending it with heartbeats while it works.
If the worker crashes, the heartbeats stop and the lease expires. A scheduler process notices, puts the task back in the queue, and bumps a delivery counter. Another worker picks it up. If a task keeps failing past a maximum number of deliveries, it's marked failed instead of looping forever.
There's a subtle problem here. What if the first worker wasn't dead, just slow (a long pause, a network stall), and it comes back and tries to report its result after someone else already took over?
That's what the fencing token is for. Every write from a worker (start, heartbeat, complete) includes its lease token. If the token is stale, the database rejects it with "lease lost" and the result is thrown away. Only the current lease holder can finish a task.
The honest summary of the guarantee: delivery is at-least-once, but completion is accepted once. If a worker performs a side effect (say, an HTTP call) and then dies before recording the result, that node will run again. Synapse can't prevent that. You need idempotency keys on the external calls, and I documented this as a known limitation instead of hiding it.
Deciding what runs next
Which nodes are ready to run depends only on the graph and the current state of each node. So I wrote that logic as a pure function in its own package, with no database and no I/O.
Two things use it:
- An in-memory runner, used to test scheduling logic quickly and exhaustively.
- The real runtime, which wraps the same function in database transactions.
This paid off. I could test conditions, merges, loops and failure handling in memory without any infrastructure, and the durable version stayed a thin shell around code I already trusted.
When a task completes, the runtime locks the execution row, records the result, asks the engine what's ready, queues those tasks, and writes events, all in one transaction. The row lock matters: if two sibling branches finish at the same moment, they take turns, so only one of them decides the join is ready or that the execution is done.
Simple nodes (conditions, merges, delays, loops) never even hit the queue. They're evaluated inside that same transaction.
Delays and versions
A delay node doesn't sleep in memory. It stores a wake-up time in the database, and the scheduler wakes it when the time comes. So a one-hour delay survives any restart.
Workflows are immutable once published. Each publish creates a new version, and every execution is pinned to the version it started with. You can edit a workflow freely without changing runs in flight, and you can always look at exactly what a past run executed.
The expression language
Nodes can use expressions like {{ trigger.amount * 1.2 }} or {{ nodes.fetch.body.items }}. I wrote a small language from scratch: a tokenizer, parser and evaluator, plus string templates and a set of built-in functions.
It has limits on depth, size and number of steps, so a bad expression can't hang a worker. There's no eval and no access to the host. Expressions are also validated when you save a workflow, so mistakes show up in the editor instead of at 3 a.m.
Live updates
Every state change writes a row to an execution_events table in the same transaction as the change. That table is the source of truth.
After commit, events are pushed to WebSocket clients through an in-process hub with bounded queues per client. If a client is too slow, it gets a "resync" message and is disconnected. It never blocks everyone else. Clients reconnect with the last event id they saw and the server replays what they missed.
Redis relays events between processes so the UI is updated within milliseconds. But Redis is only an accelerator. If it's missing or drops a message, the server also tails the events table, so nothing is lost. It's just slower.
Replay
Replay never changes history. It starts a new execution of the same version, linked to the original. A full replay reuses the original trigger data. A replay from node N copies the recorded outputs of everything not downstream of N, marks them as already succeeded, and schedules N. So you re-run only the part you care about.
Security
- Passwords use argon2id. Sessions are random opaque tokens, stored hashed.
- Roles per workspace: viewer, member, admin, owner. Non-members get a 404 so workspace ids can't be probed.
- Webhooks are verified with an HMAC signature, compared in constant time, and rate limited.
- The HTTP node has an SSRF guard. It blocks private, loopback and link-local addresses, and re-checks after DNS resolution and on redirects.
- Secrets are encrypted with AES-256-GCM and masked in stored outputs and events.
Observability
Prometheus metrics come from the API and workers. Logs are structured JSON with request and execution ids. Traces go out over OTLP, and a trace context stored on the execution links the API request and the worker span into one trace. I checked this in Jaeger.
How I tested it
- 205 Go tests, passing under the race detector. Statement coverage across everything is 79.9%, measured with cross-package coverage.
- Failure injection with real processes: kill a worker mid-task with SIGKILL, kill the API mid-run, restart Postgres, shut down gracefully. In each case the work completes and nothing is lost or duplicated.
- An end-to-end test from a webhook request through a worker to a finished result.
- 54 frontend tests, plus a manual headless-browser pass through the whole UI.
staticcheck,go vetandgovulncheckare clean.
Benchmarks
All numbers below come from real runs saved in the repo. One important caveat: everything ran on one laptop (Intel i5-7300HQ, 4 cores, 15 GB). The load generator, API, workers and Postgres all shared those four cores, and each configuration was run once. Treat these as a lower bound, not a scale claim.
| What | Result |
|---|---|
| Peak throughput (3-task workflow) | about 443 tasks/s, 148 executions/s |
| Latency at 100 executions/s | p50 / p95 / p99 = 17 / 30 / 44 ms |
| Overload at 300/s (about 2× capacity) | all 6,000 completed, 0 failed, queue grew (p50 22.8 s) |
Cost of real durability (fsync=on) |
195 tasks/s vs 443, about 2.3× slower |
| WebSocket latency with Redis | p50 3–5 ms, 100 subscribers, 90,000 events, none missing |
| WebSocket latency without Redis | about 2 s (the database poll interval), still complete |
Adding workers didn't raise throughput: one worker gave 408 tasks/s, two gave 443 and four gave 441. I didn't profile it, so I can't say what the limit is. It's consistent with the shared cores being saturated, but I haven't proven it.
Things the testing caught
Two bugs found by actually measuring and looking:
- Missing events without Redis. My first WebSocket benchmark showed only 600 of 900 events reaching the workspace stream when Redis was off. Every "execution succeeded" event was missing, because workers commit those, and the API only heard about them through Redis. I added a shared database tail for the workspace stream, with de-duplication. The rerun got 900 of 900.
- A broken editor. In a real browser, the graph editor looked wrong: nodes were misplaced and the minimap was white. I had never imported React Flow's stylesheet. Unit tests couldn't have caught that. A real browser did.
Limitations
- At-least-once: side effects can repeat after a crash. Use idempotency keys.
- One Postgres: throughput is bounded by its commit rate. There's no sharding and no high-availability setup.
- Without Redis, live updates are slower (up to about 2 s).
- Kubernetes: the manifests have never been applied to a real cluster.
- Multi-host scaling is not demonstrated. Only single-host numbers exist.
- The email node uses a mock mailer, and there's no SSO or audit log.
- Two moderate
npm auditadvisories inreact-router6 remain. The fix is a breaking upgrade, and the app doesn't use the affected features (SSR, dynamic redirects).
What I learned
- A database can be a perfectly good queue if you want atomic state changes, but you pay for it in commit rate, and
fsyncmatters a lot. - Leases alone aren't enough. You need fencing tokens to stop a slow worker from overwriting a newer result.
- Keep the decision logic pure. It makes the hardest part the easiest to test.
- Treat real-time pushes as an optimisation over a log clients can replay. Then losing a message costs latency, not correctness.
- Measure before claiming. Both of the real bugs I found came from running the thing, not from reading the code.
Try it
make docker-up
scripts/seed-demo.sh http://localhost:8088
# open http://localhost:8088
# log in with demo@synapse.local / synapse-demo-password
The architecture doc, the ten design decision records, and the raw benchmark results are all in the docs/ folder.